Mnist handwritten digit classification using tensorflow
Milind Soorya / September 16, 2021
8 min read
Introduction
What is Handwritten Digit Recognition?
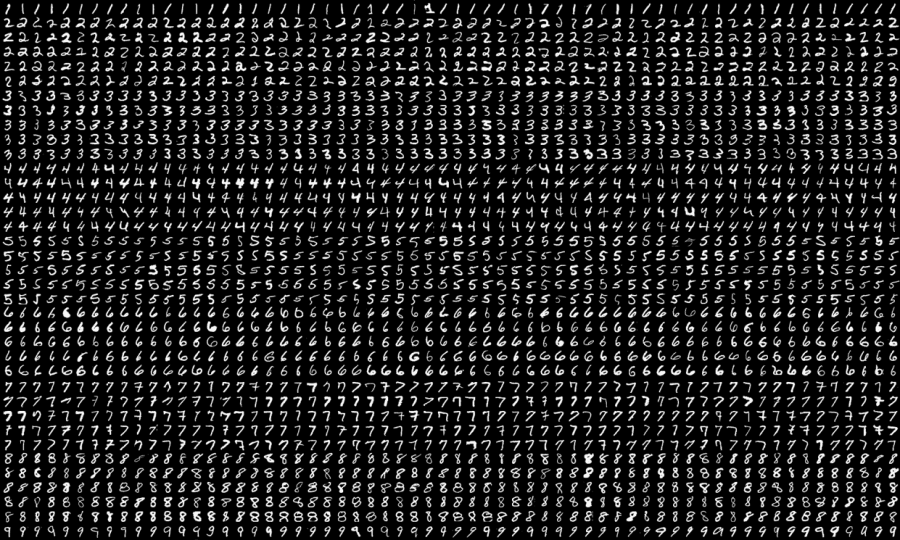
Handwritten digit recognition is the ability of computers to recognize human handwritten digits. It is a hard task for the machine because handwritten digits are not perfect and can vary from person to person. Handwritten digit recognition is the solution to this problem which uses the image of a digit and recognizes the digit present in the image.
The MNIST dataset
This is probably one of the most popular datasets among machine learning and deep learning enthusiasts. The MNIST dataset contains 60,000 training images of handwritten digits from zero to nine and 10,000 images for testing. So, the MNIST dataset has 10 different classes. The handwritten digits images are represented as a 28×28 matrix where each cell contains grayscale pixel value.
In this article, we will look at the MNIST dataset and create a simple neural network using TensorFlow and Keras. Later we will also add a hidden layer to make the model more accurate.
TLDR; MNIST handwritten digit classification github
Here for the code? You can find the python Notebook in my GitHub.
Import the modules
import tensorflow as tf
from tensorflow import keras
import matplotlib.pyplot as plt
%matplotlib inline
import numpy as np
Load the MNIST dataset from Keras
(x_train, y_train), (x_test, y_test) = keras.datasets.mnist.load_data()

len(x_train)
# 60000

len(x_test)
# 10000

# Finding the shape of individual sample
x_train[0].shape
# (28, 28)
hence, each sample is a 28x28 pixel image
x_train[0]
The value ranges 0-255. 0 means the pixel at that point has no intensity and 255 has the highest intensity.
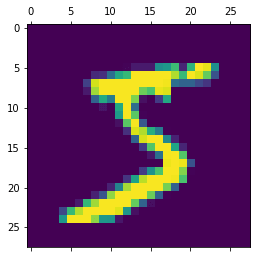
See the images
plt.matshow(x_train[0])
y_train[0]

# 5
# Show first 5 data
y_train[:5]

# array([5, 0, 4, 1, 9], dtype=uint8)
Flatten the training data
we need to convert the two-dimensional input data into a single-dimensional format for feeding into the model. This is achieved by a process called flattening. In this process, the 28x28 grid image is converted into a single-dimensional array of 784(28x28).
x_train.shape

#  (60000, 28, 28)
# Scale the data so that the values are from 0 - 1
x_train = x_train / 255
x_test = x_test / 255
x_train[0]
# Flattening the train and test data
x_train_flattened = x_train.reshape(len(x_train), 28*28)
x_test_flattened = x_test.reshape(len(x_test), 28*28)
x_train_flattened.shape

# (60000, 784)
x_train_flattened.shape

# (60000, 784)
PART 1 - Create a simple neural network in Keras
In this step, we will create the most simple, single-layer neural network using Keras.
# Sequential create a stack of layers
model = keras.Sequential([
    keras.layers.Dense(10, input_shape=(784,), activation='sigmoid')
])

# Optimizer will help in backproagation to reach better global optima
model.compile(
    optimizer='adam',
    loss='sparse_categorical_crossentropy',
    metrics=['accuracy']
)

# Does the training
model.fit(x_train_flattened, y_train, epochs=5)
# OUTPUT

    Epoch 1/5
    1875/1875 [==============================] - 3s 2ms/step - loss: 0.4659 - accuracy: 0.8784
    Epoch 2/5
    1875/1875 [==============================] - 3s 1ms/step - loss: 0.3040 - accuracy: 0.9145
    Epoch 3/5
    1875/1875 [==============================] - 3s 1ms/step - loss: 0.2828 - accuracy: 0.9206
    Epoch 4/5
    1875/1875 [==============================] - 3s 1ms/step - loss: 0.2733 - accuracy: 0.9234
    Epoch 5/5
    1875/1875 [==============================] - 3s 1ms/step - loss: 0.2667 - accuracy: 0.9259
After the training, I got an accuracy of around 92%, which is not bad considering we created a single-layer neural network.
Evaluate the accuracy of test data
model.evaluate(x_test_flattened, y_test)
# OUTPUT
313/313 [==============================] - 1s 1ms/step - loss: 0.2702 - accuracy: 0.9241
So, we were able to get an accuracy of 92% with the test data.
Sample prediction
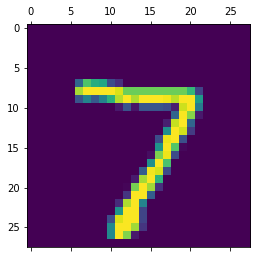
We will now visualize the result by showing the image and making the prediction and validating it.
# Show the image
plt.matshow(x_test[0])
# Make the predictions
y_predicted = model.predict(x_test_flattened)
y_predicted[0]

    array([1.8693238e-02, 2.5351633e-07, 3.8469851e-02, 9.5759392e-01,
           2.0694137e-03, 1.0928032e-01, 1.0289272e-06, 9.9976790e-01,
           6.6316605e-02, 6.9463903e-01], dtype=float32)
# Find the maximum value using numpy
np.argmax(y_predicted[0])

# 7
# converting y_predicted from whole numbers to integers
# so that we can use it in confusion matrix
# In short we are argmaxing the entire prediction
y_predicted_labels = [np.argmax(i) for i in y_predicted]
y_predicted_labels[:5]

# [7, 2, 1, 0, 4]
Using confusion matrix for validation
If you are confused about the confusion matrix, read this small article before proceeding - The ultimate guide to confusion matrix in machine learning
cm = tf.math.confusion_matrix(labels=y_test, predictions=y_predicted_labels)
cm
# OUTPUT
 <tf.Tensor: shape=(10, 10), dtype=int32, numpy=
    array([[ 965,    0,    0,    2,    0,    4,    5,    2,    2,    0],
           [   0, 1109,    3,    2,    1,    1,    4,    2,   13,    0],
           [   7,    9,  905,   27,    8,    4,   13,   10,   44,    5],
           [   3,    0,   12,  930,    0,   26,    2,   10,   16,   11],
           [   1,    1,    4,    2,  906,    0,   11,    4,    9,   44],
           [  10,    1,    1,   41,    8,  772,   14,    6,   31,    8],
           [  13,    3,    5,    2,    7,   15,  909,    2,    2,    0],
           [   1,    5,   20,   11,    7,    0,    0,  943,    2,   39],
           [   7,    7,    5,   26,    9,   22,    8,   11,  867,   12],
           [  11,    6,    1,   12,   21,    5,    0,   14,    4,  935]],
          dtype=int32)>
Using seaborn to make confusion matrix look good
import seaborn as sn
plt.figure(figsize = (10,7))
sn.heatmap(cm, annot=True, fmt='d')
plt.xlabel('Predicted')
plt.ylabel('Truth')
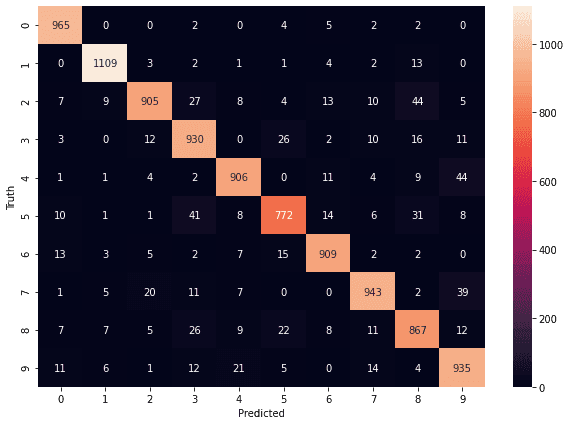
The confusion matrix gives a clear picture of our prediction.
How to read the confusion matrix?
- All the diagonal elements are correct predictions, for example, we correctly predicted the number 0, 958 times.
- The black cells, value shows the wrong predictions. For each number n in the cell, it means that we predicted the value in the truth row as the value is the predicted column, n times. For Example, 3 was predicted as 2, 17 times.
PART 2 - Adding a hidden layer
# Sequential create a stack of layers
# Create a hidden layer with 100 neurons and relu activation
model = keras.Sequential([
    keras.layers.Dense(100, input_shape=(784,), activation='relu'),
    keras.layers.Dense(10, activation='sigmoid')
])

# Optimizer will help in backproagation to reach better global optima
model.compile(
    optimizer='adam',
    loss='sparse_categorical_crossentropy',
    metrics=['accuracy']
)

# Does the training
model.fit(x_train_flattened, y_train, epochs=5)
    Epoch 1/5
    1875/1875 [==============================] - 5s 2ms/step - loss: 0.2785 - accuracy: 0.9202
    Epoch 2/5
    1875/1875 [==============================] - 5s 2ms/step - loss: 0.1278 - accuracy: 0.9624
    Epoch 3/5
    1875/1875 [==============================] - 4s 2ms/step - loss: 0.0904 - accuracy: 0.9731
    Epoch 4/5
    1875/1875 [==============================] - 4s 2ms/step - loss: 0.0677 - accuracy: 0.9796
    Epoch 5/5
    1875/1875 [==============================] - 4s 2ms/step - loss: 0.0542 - accuracy: 0.9835
Evaluate the accuracy of the test set
model.evaluate(x_test_flattened, y_test)


313/313 [==============================] - 1s 1ms/step - loss: 0.0769 - accuracy: 0.9759
Now we can observe that by adding a hidden layer the accuracy increased from 92% to 97%.
Using confusion matrix for validation
y_predicted = model.predict(x_test_flattened)
y_predicted_labels = [np.argmax(i) for i in y_predicted]

cm = tf.math.confusion_matrix(labels=y_test, predictions=y_predicted_labels)

import seaborn as sn
plt.figure(figsize = (10,7))
sn.heatmap(cm, annot=True, fmt='d')
plt.xlabel('Predicted')
plt.ylabel('Truth')
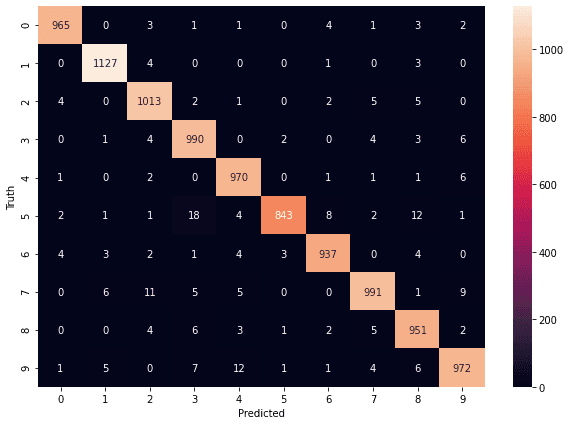
Compared to the previous confusion matrix the wrong predictions has gone down. We can see that the diagonal values have increased and the values in black cells have gone down. There are more '0' valued black cells, meaning correct predictions.
Bonus Content
flattening out data each time is really tedious, don't worry keras got you covered. Just use the keras.layers.Flatten like the example below
# Flattening data using keras Flatten class
model = keras.Sequential([
    keras.layers.Flatten(input_shape=(28,28)),
    keras.layers.Dense(100, activation='relu'),
    keras.layers.Dense(10, activation='sigmoid')
])

model.compile(
    optimizer='adam',
    loss='sparse_categorical_crossentropy',
    metrics=['accuracy']
)

model.fit(x_train_flattened, y_train, epochs=5)
    Epoch 1/5
    1875/1875 [==============================] - 5s 2ms/step - loss: 0.2693 - accuracy: 0.9243
    Epoch 2/5
    1875/1875 [==============================] - 5s 2ms/step - loss: 0.1230 - accuracy: 0.9637
    Epoch 3/5
    1875/1875 [==============================] - 4s 2ms/step - loss: 0.0851 - accuracy: 0.9747
    Epoch 4/5
    1875/1875 [==============================] - 4s 2ms/step - loss: 0.0644 - accuracy: 0.9803
    Epoch 5/5
    1875/1875 [==============================] - 4s 2ms/step - loss: 0.0508 - accuracy: 0.9846
Next step
Try playing around with different activation functions, optimizers, loss functions and epochs to optimize the model. In case of doubt ping me on Twitter
- Activation Functions - https://keras.io/api/layers/activations/
- Optimizers - https://keras.io/api/optimizers/
- Loss functions - https://keras.io/api/losses/
Conclusion
In this article, I discussed how to tackle the MNIST Digit Recognition problem by creating a simple Neural Network.
As a next step, I will do the same problem using Convoluted Neural Network(CNN), to read that as soon as it drops, please follow me on Twitter.
Thanks again for reading, have a nice day.
💡 UPDATE : Mnist handwritten digit classification using CNN